Initiating Coverage| Consumer Durable
June 21, 2018
Amber Enterprises India Ltd
BUY
CMP
`965
A well ‘conditioned’ bet on the booming AC space
Target Price
`1272
Amber Enterprises India Ltd. (Amber) is the market leader in the room air
Investment Period
12 Months
conditioners (RAC) outsourced manufacturing space in India. It is a one-stop
solutions provider for the major brands in the RAC industry and currently serves
eight out of the ten top RAC brands in India. Its growing manufacturing
Stock Info
capabilities and scale put it in a sweet spot to capture the underpenetrated RAC
Sector
Consumer Durable
market in India.
Market leadership driven by integration and R&D: Amber commands ~19%
Market Cap (` cr)
3,035
market share in RAC manufacturing through its 12 manufacturing facilities
Beta
0.7
located across India. In a short span of nine years, it has evolved from being
52 Week High / Low
1327/964
original equipment manufacturing (OEM) to high-margin Original Design
Avg. Daily Volume
63,284
Manufacturing (ODM, forms 85% of revenue) in RAC mainly led by aggressive
Face Value (`)
10
backward integration and R&D capabilities.
BSE Sensex
35,547
Favorable industry trends: RAC industry is growing at 10%+CAGR where ODM’s
Nifty
10,772
share is expected to grow to reach 56% of the RAC market by 2022 (from current
Reuters Code
AMBE.BO
34%). These factors favor Amber owing to its focus on ODM. Further, the product
Bloomberg Code
AMBER.IN
approval cycle goes beyond 2-3 years creating a moat for Amber to keep the
competition under check. After the recent acquisitions in the Printed Circuit Board
Shareholding Pattern (%)
space, it can manufacture up to 90% of an RAC barring compressor.
Promoters
44.0
Strong boost in profits and debt reduction: The company improved its margins to
MF / Banks / Indian Fls
33.0
8.6% in FY2018 led by higher capacity utilization amid robust RACs’ demand.
Due to its recent acquisitions (~20-22% of FY2019 revenue) which have lower
FII / NRIs / OCBs
10.8
margins, overall margins may not expand in near term, but operating profits
Indian Public / Others
12.2
would see good absolute jump. Repayment of its LT debt from IPO proceeds has
substantially reduce its interest cost and will boost earnings amid limited capex
Abs.(%)
3m 1yr
3yr
requirements.
Sensex
7.2
14.5
31.1
Outlook & Valuation: We expect Amber to report consolidated revenue/PAT
Amber
(12.8)
CAGR of 28%/51% respectively over FY2018-20E. It is currently trading at 21x FY
2020 earnings which is at 25-30% discount than its closest peer - Dixon
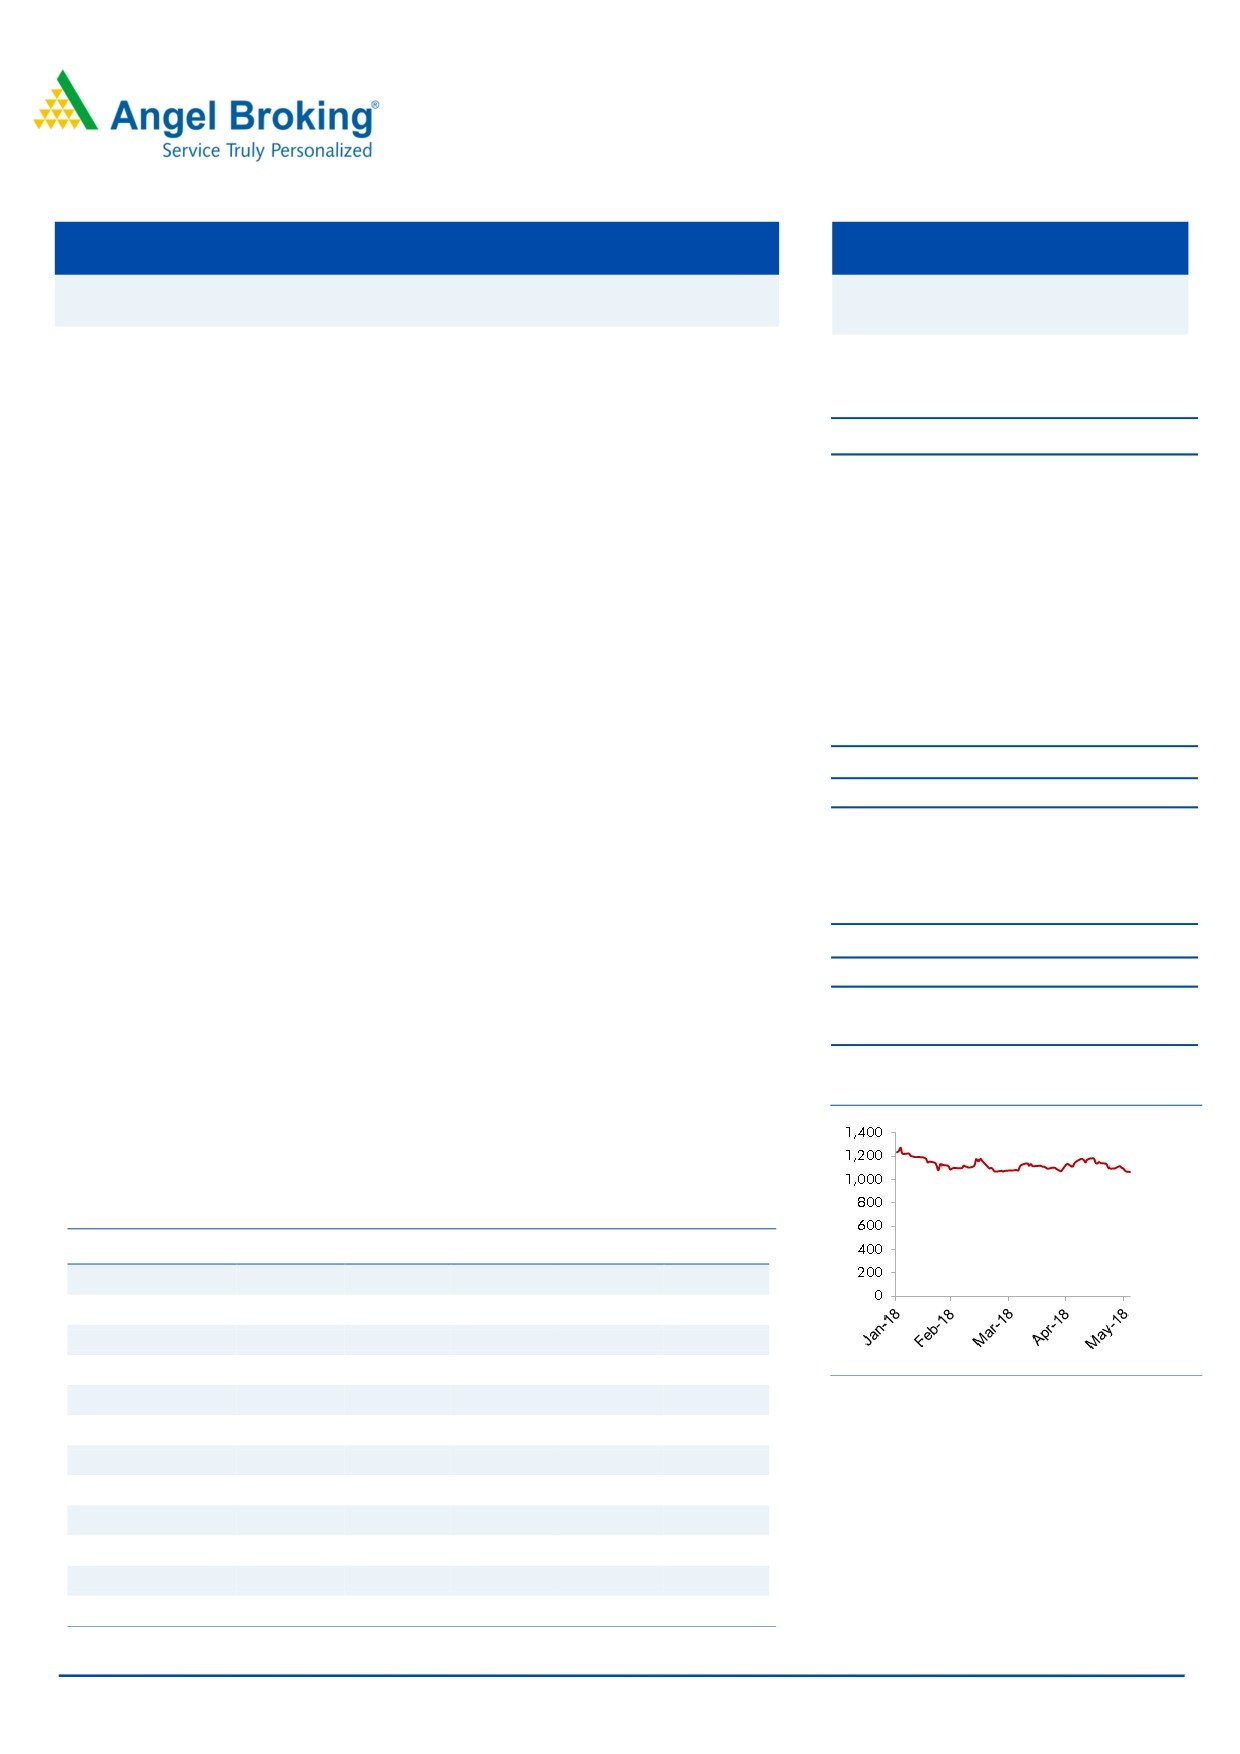
3-year price chart
Technologies. The recent correction has provided a very good entry point for the
investors to take a bet on the booming AC space. Hence, we initiate coverage on
the stock with a BUY recommendation and Target Price of `1272 (28x FY2020E
EPS), an upside of 32% from the current levels.
Key Financial
Y/E March (` cr)
FY2016
FY2017
FY2018
FY2019E
FY2020E
Net Sales
1,089.0
1,651.9
2,128.1
2,957.5
3,489.8
% chg
-11.5
51.7
28.8
39.0
18.0
Net Profit
24.1
25.2
62.3
113.0
142.9
% chg
-13.5
4.5
147.4
81.4
26.4
Source: Company, Angel Research
EBITDA (%)
10.4
7.9
8.6
7.5
7.5
EPS (Rs)
7.7
8.0
19.8
35.9
45.4
P/E (x)
125.9
120.5
48.7
26.8
21.2
Nidhi Agrawal
P/BV (x)
11.6
9.1
3.4
3.1
2.7
+022 39357600, Extn: 6872
RoE (%)
9.2
7.5
7.0
11.4
12.9
RoCE (%)
14.1
13.3
13.5
15.7
17.2
EV/EBITDA
29.1
25.4
16.0
12.8
10.6
EV/Sales
3.0
2.0
1.4
1.0
0.8
Source: Angel Research; CMP calculated at the end of 20th June 2018
Please refer to important disclosures at the end of this report
1
Amber Enterprises | Initiating Coverage
Company background
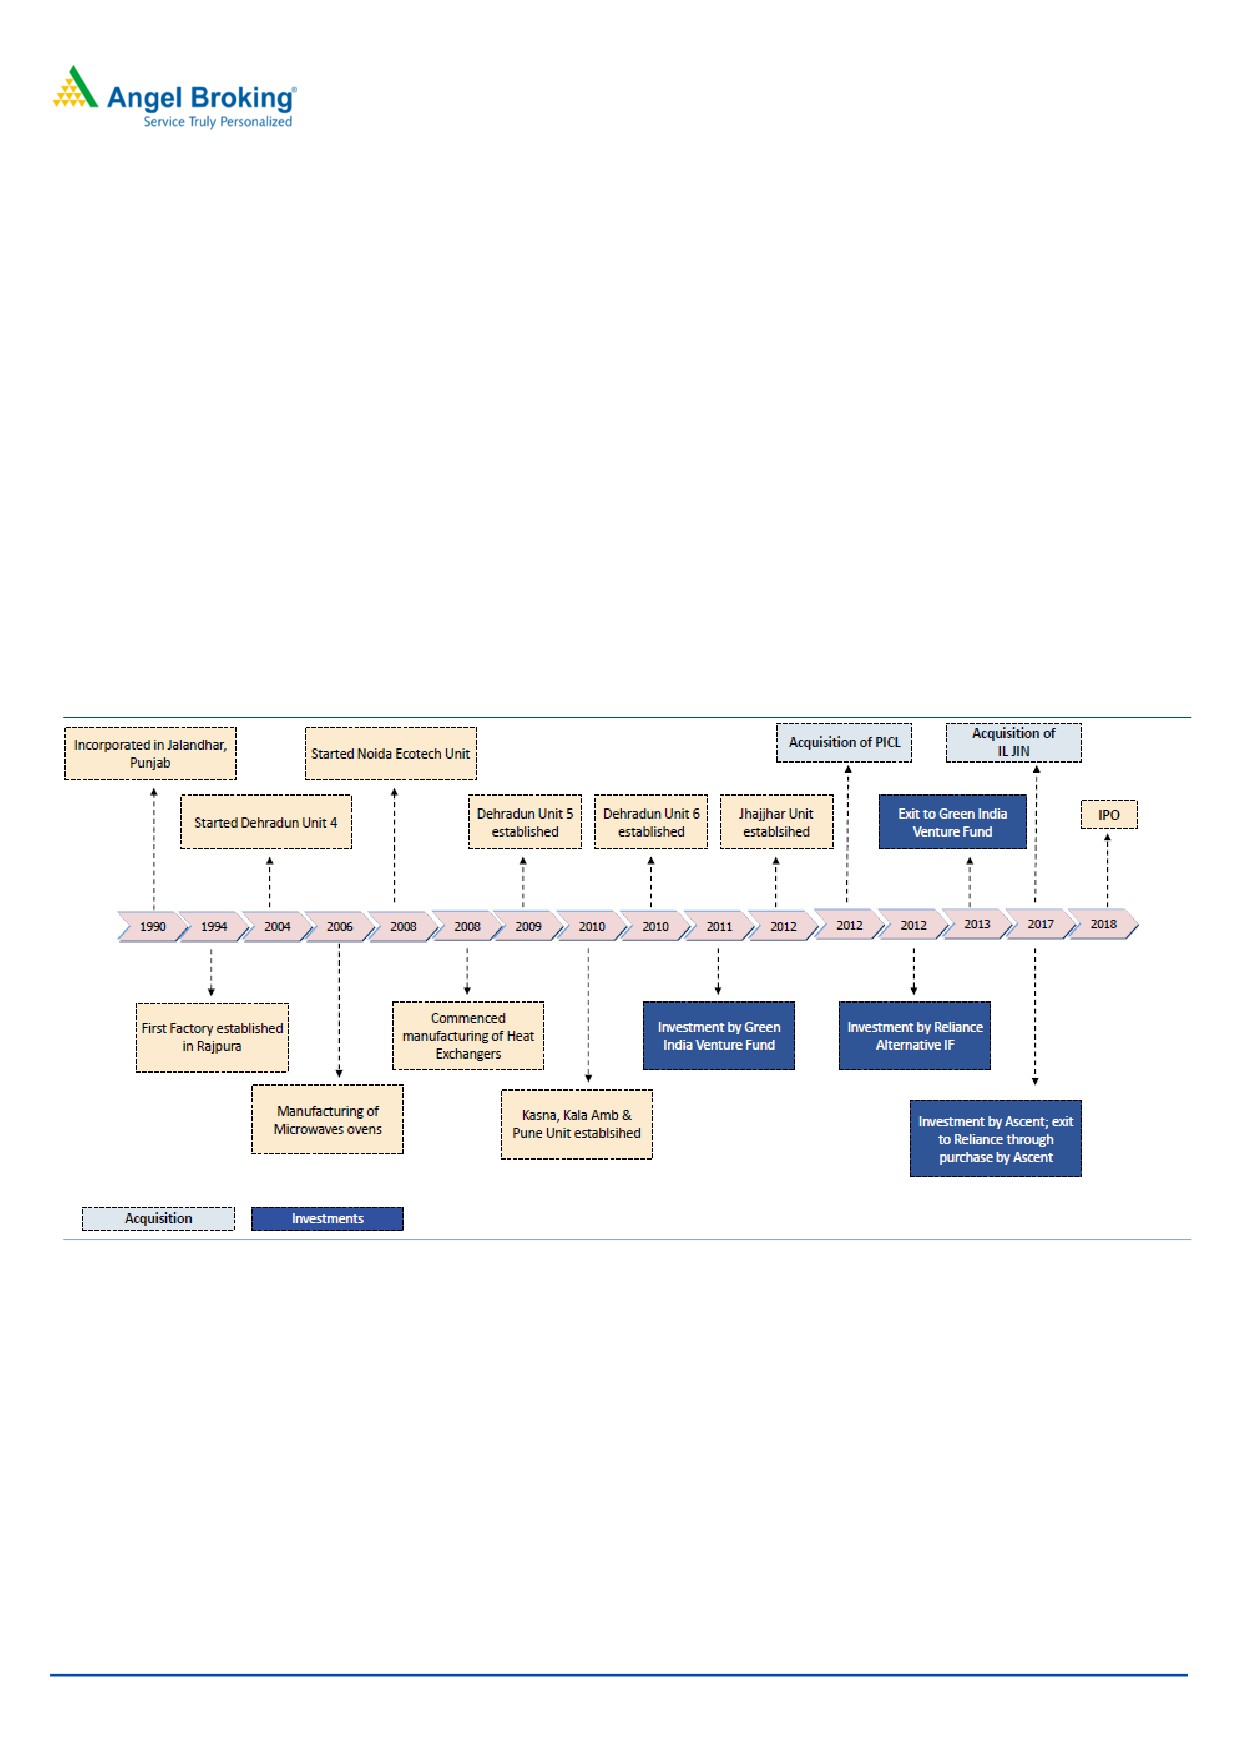
The company was incorporated as Amber Enterprises India Private Limited on April
2, 1990 at Jalandhar, Punjab, as a private limited company under the Companies
Act, 1956. It was converted to a public limited company pursuant to a special
resolution passed by its shareholders on September 20, 2017. From a single
factory in Rajpura, Punjab, that commenced operations in 1994, it has grown to
12 manufacturing facilities across seven locations in India. Its manufacturing
facilities have a high degree of backward integration and are strategically located
in proximity to its customers’ facilities. It has also seen three rounds of private
capital infusion (IFCI Venture Capital Funds Limited, Reliance Alternative
Investments Fund - Private Equity Scheme-I through Fairwinds Trustees Services
Private Limited and ADV Opportunities Fund LLP through their investment entity
Ascent). In January 2018, it came out with an IPO.
Exhibit 1: Company timeline
Source: Company, Angel Research
Product portfolio:
RAC: It designs and manufactures complete RAC including window air
conditioners (WAC), indoor units (IDU) and outdoor units (ODU) of split air
conditioners (SAC) with specifications ranging from 0.75 ton to 2 ton, across
energy ratings and types of refrigerants.
RAC Components: It manufactures critical and reliability functional
components of RACs such as heat exchangers, motors and multi-flow
condensers. It manufactures other RAC components such as sheet metal
components, copper tubing and injection molding components.
June 21, 2018
2
Amber Enterprises | Initiating Coverage
Other Components: It manufactures components for other consumer durables
and automobiles such as case liners for refrigerator, plastic extrusion sheets
for consumer durables and automobile industry, sheet metal components for
microwave, washing machine tub assemblies and for automobiles and metal
ceiling industries.
Exhibit 2: Revenue break-up
` Cr
FY14
FY15
FY16
FY17
FY18
CAGR
Air Conditioners
526
699
699
1252
1525
31%
Ac components
186
212
210
189
293
12%
Non AC components
262
319
179
210
310
4%
Total sales -` cr
973
1230
1089
1652
2128
22%
Total sales volume - '000
516
684
800
1514
1910
39%
Source: Company, Angel Research
Key Management Personnel
Jasbir Singh is the Chairman and Chief Executive Officer of the Company. He
holds a Bachelors degree in engineering (industrial production) from Karnataka
University and Masters degree in business administration from the University of
Hull, United Kingdom. He was appointed to the Board of the Company since
October 1, 2004. He has over 13 years of experience in the RAC manufacturing
sector. He has played an instrumental role in successful acquisition of PICL (India)
Private Limited in 2012.
Daljit Singh is the Managing Director of the Company. He holds a Bachelors
degree in electronic engineering from Nagpur University and Masters degree in
information technology from the Rochester Institute of Technology. He has received
‘Entrepreneur of the Year 2016’ award from Ludhiana Management Association.
He was appointed to the Board of the Company on January 1, 2008. Prior to
joining this Company, he was associated with Morgan Stanley in New York as an
analyst.
Manoj Kumar Sehrawat is a Nominee Director of the Company nominated by
Ascent and was appointed to the Board of Company in January 12, 2017. He has
20 years of experience in financial services. He is a managing director at ADV
Partners Management Pte. Limited (ADV), the manager to a sub fund of ADV
Opportunities Fund LLP, a Cayman Islands exempted limited partnership.
June 21, 2018
3
Amber Enterprises | Initiating Coverage
Investment Rationale
Favorable industry trends
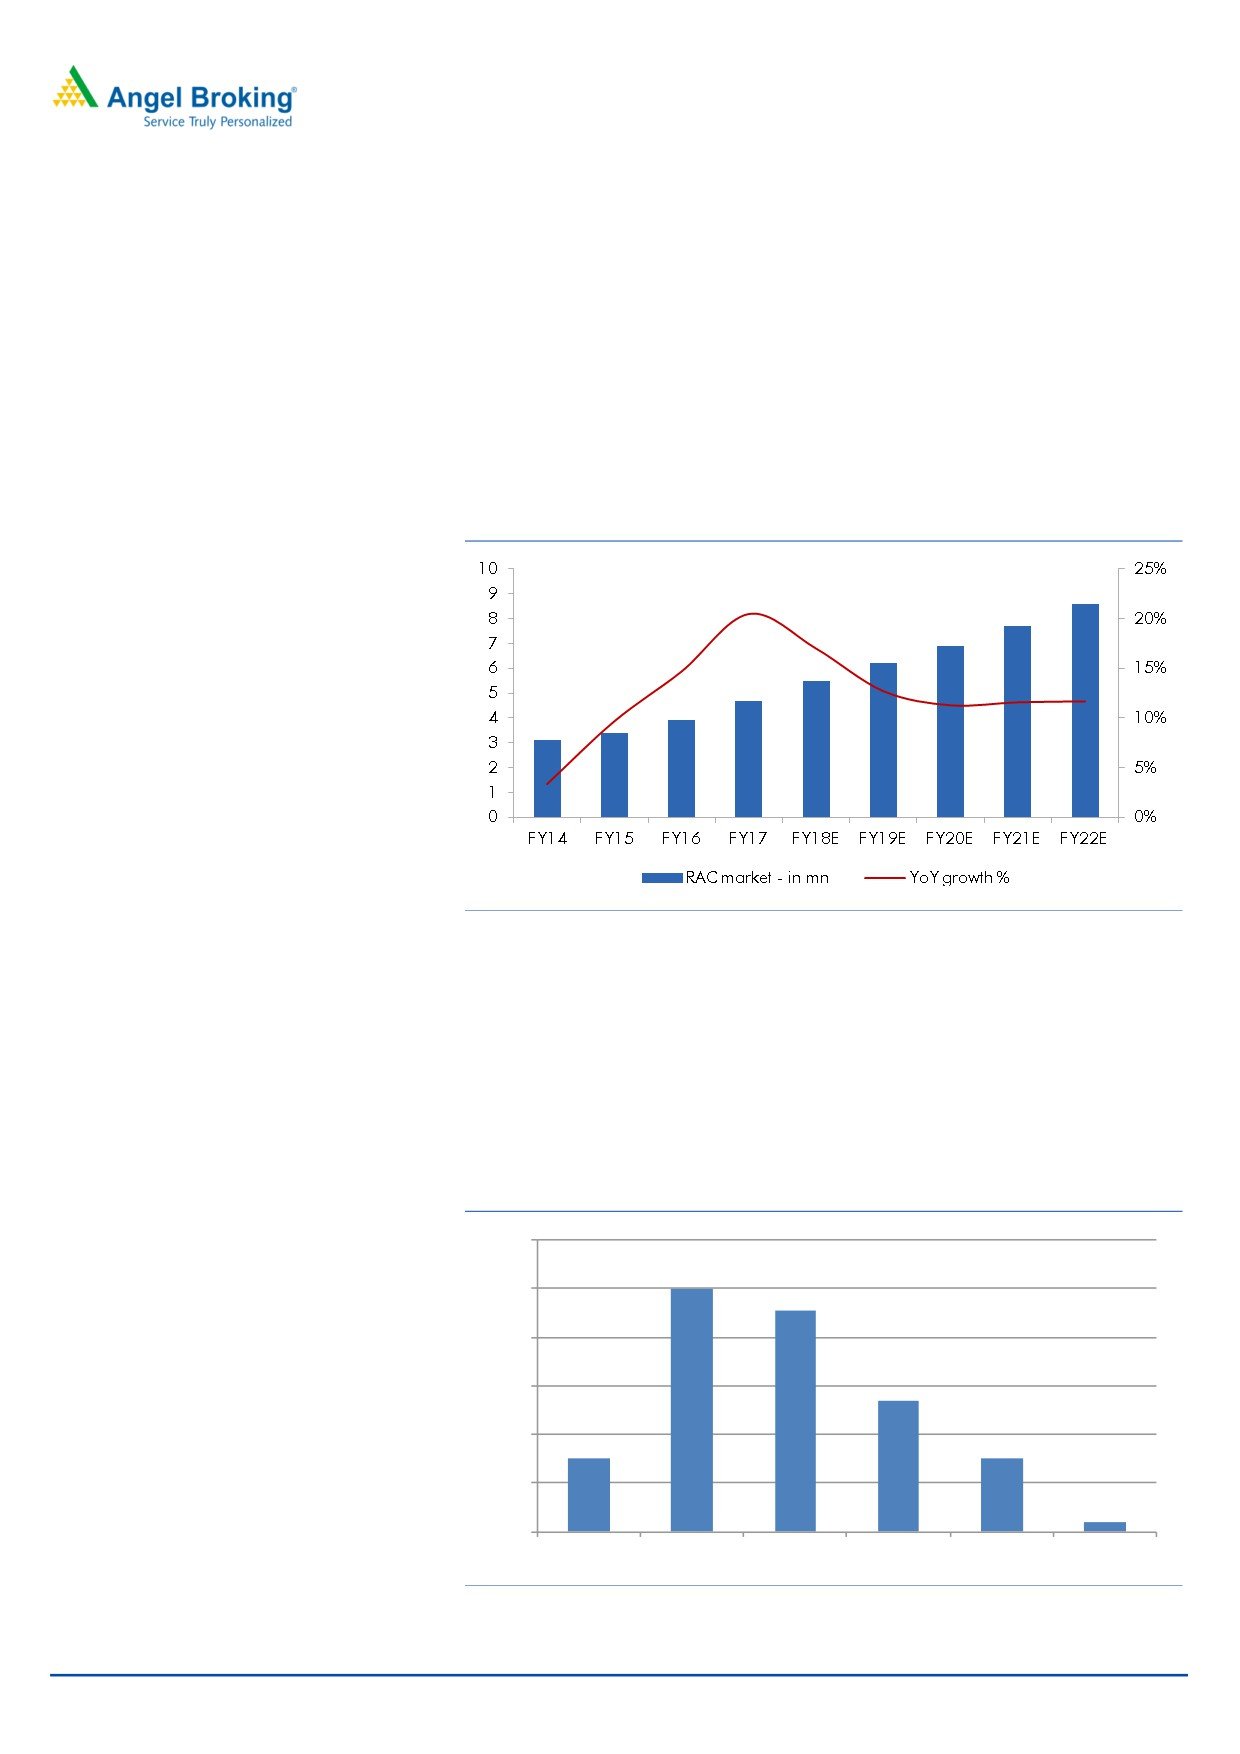
Amber is in a sweet spot, as the RAC industry is growing at 10%+CAGR. The
growth of this industry is driven by the increase in disposable income, humid
climate of India, urbanization and easy consumer financing. The RAC volumes are
expected to increase from 4.7 million units in FY2017 to reach 8.6 million units by
FY2022E.
Exhibit 3: ACs volume growth to remain buoyant
Source: Company, Frost and Sullivan
Lower penetration in India provides huge opportunity
Due to the current low penetration of 4% versus (53% in China/ global average-
30%), the Indian RAC market presents huge opportunity for players to garner
larger share of the market. Viewed as a luxury product in the recent past, the
sweltering and longer summers in the country have led to creation of new demand
for RACs not only in the larger cities, but also in Tier II/III cities amid better
affordability.
Exhibit 4: RAC penetration level across countries
120%
100%
80%
60%
40%
20%
0%
Global
China
Japan
Malaysia
Thailand
India
Source: Industry , Angel Research
June 21, 2018
4
Amber Enterprises | Initiating Coverage
Preference for local OEM/ODMs in India
RAC brands have established manufacturing units in India to hedge against higher
cost of manufacturing in China. China has enjoyed an advantageous position in
low cost manufacturing however due to issues in supply chain management, such
as logistics costs, lead time, higher working capital, rising wages, etc., forced
manufacturers to explore alternative locations to maintain cost. Global RAC brands
now prefer India as the new manufacturing location for addressing the domestic
demand and also for limited exports.
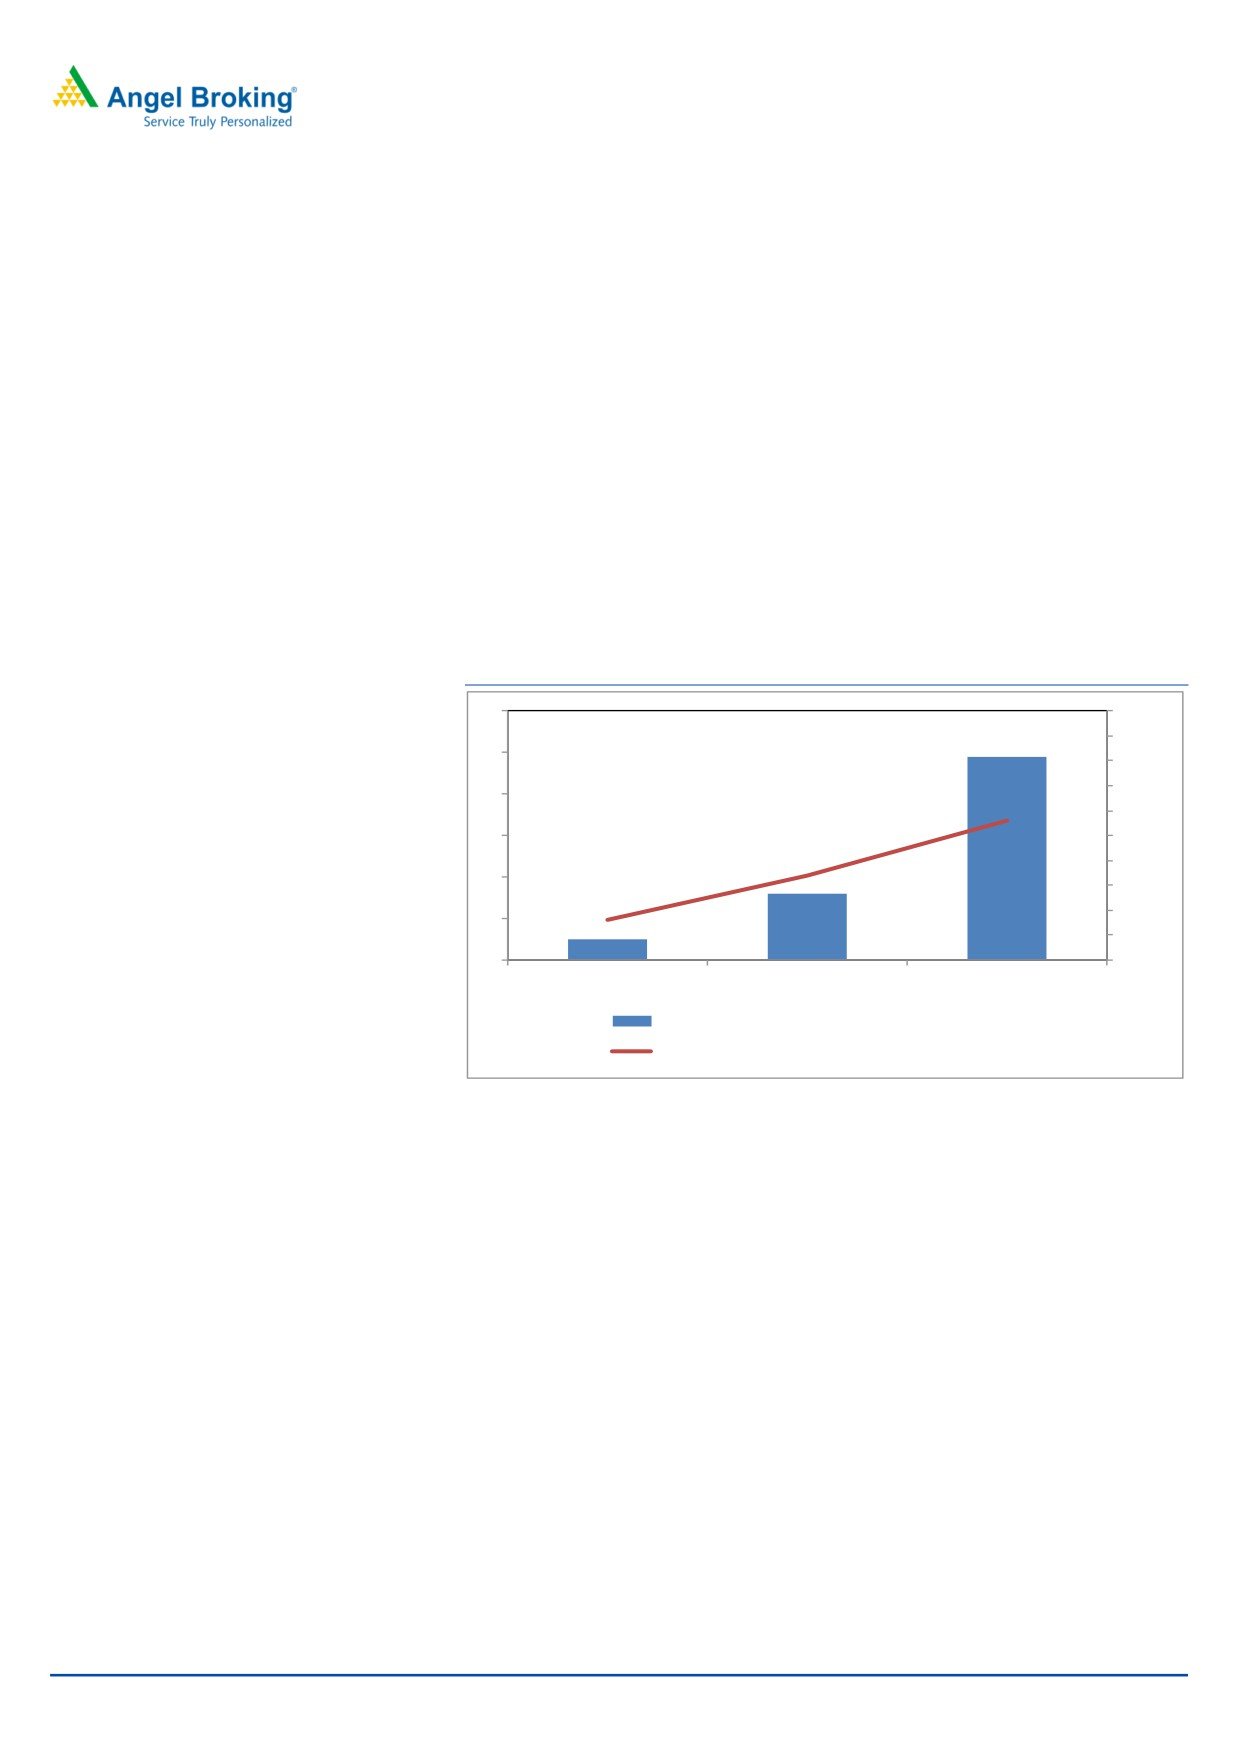
OEM/ODM share to rise
In the RAC industry, the share of OEM/ODM is expected to grow by 25% CAGR to
reach 56% of the RAC market by 2022 (from current 34%). These factors favor
Amber owing to its focus on ODM. Further, the product approval cycle goes
beyond 2-3 years creating a moat for Amber to keep the competition under check.
Exhibit 5: Rising share of OEM/ODM
100%
6
90%
5
80%
70%
4
60%
3
50%
40%
2
30%
20%
1
10%
0
0%
FY12
FY17
FY22E
ODM/ OEM volume (Mn) (LHS)
Conribution as % of total RAC volume (RHS)
Market leadership driven by integration and R&D
Amber commands 19% market share in Indian RAC manufacturing through its 12
manufacturing facilities strategically located across India. In a short span of nine
years, it has evolved from being original equipment manufacturing (OEM) to high-
margin Original Design Manufacturing (ODM) in RACs mainly led by high degree
of backward integration and strong R&D capabilities. The company has been
plugging via inorganic acquisitions like PICL for its fractional horse power motors
capabilities in 2012 and 2 companies in FY2018.
June 21, 2018
5
Amber Enterprises | Initiating Coverage
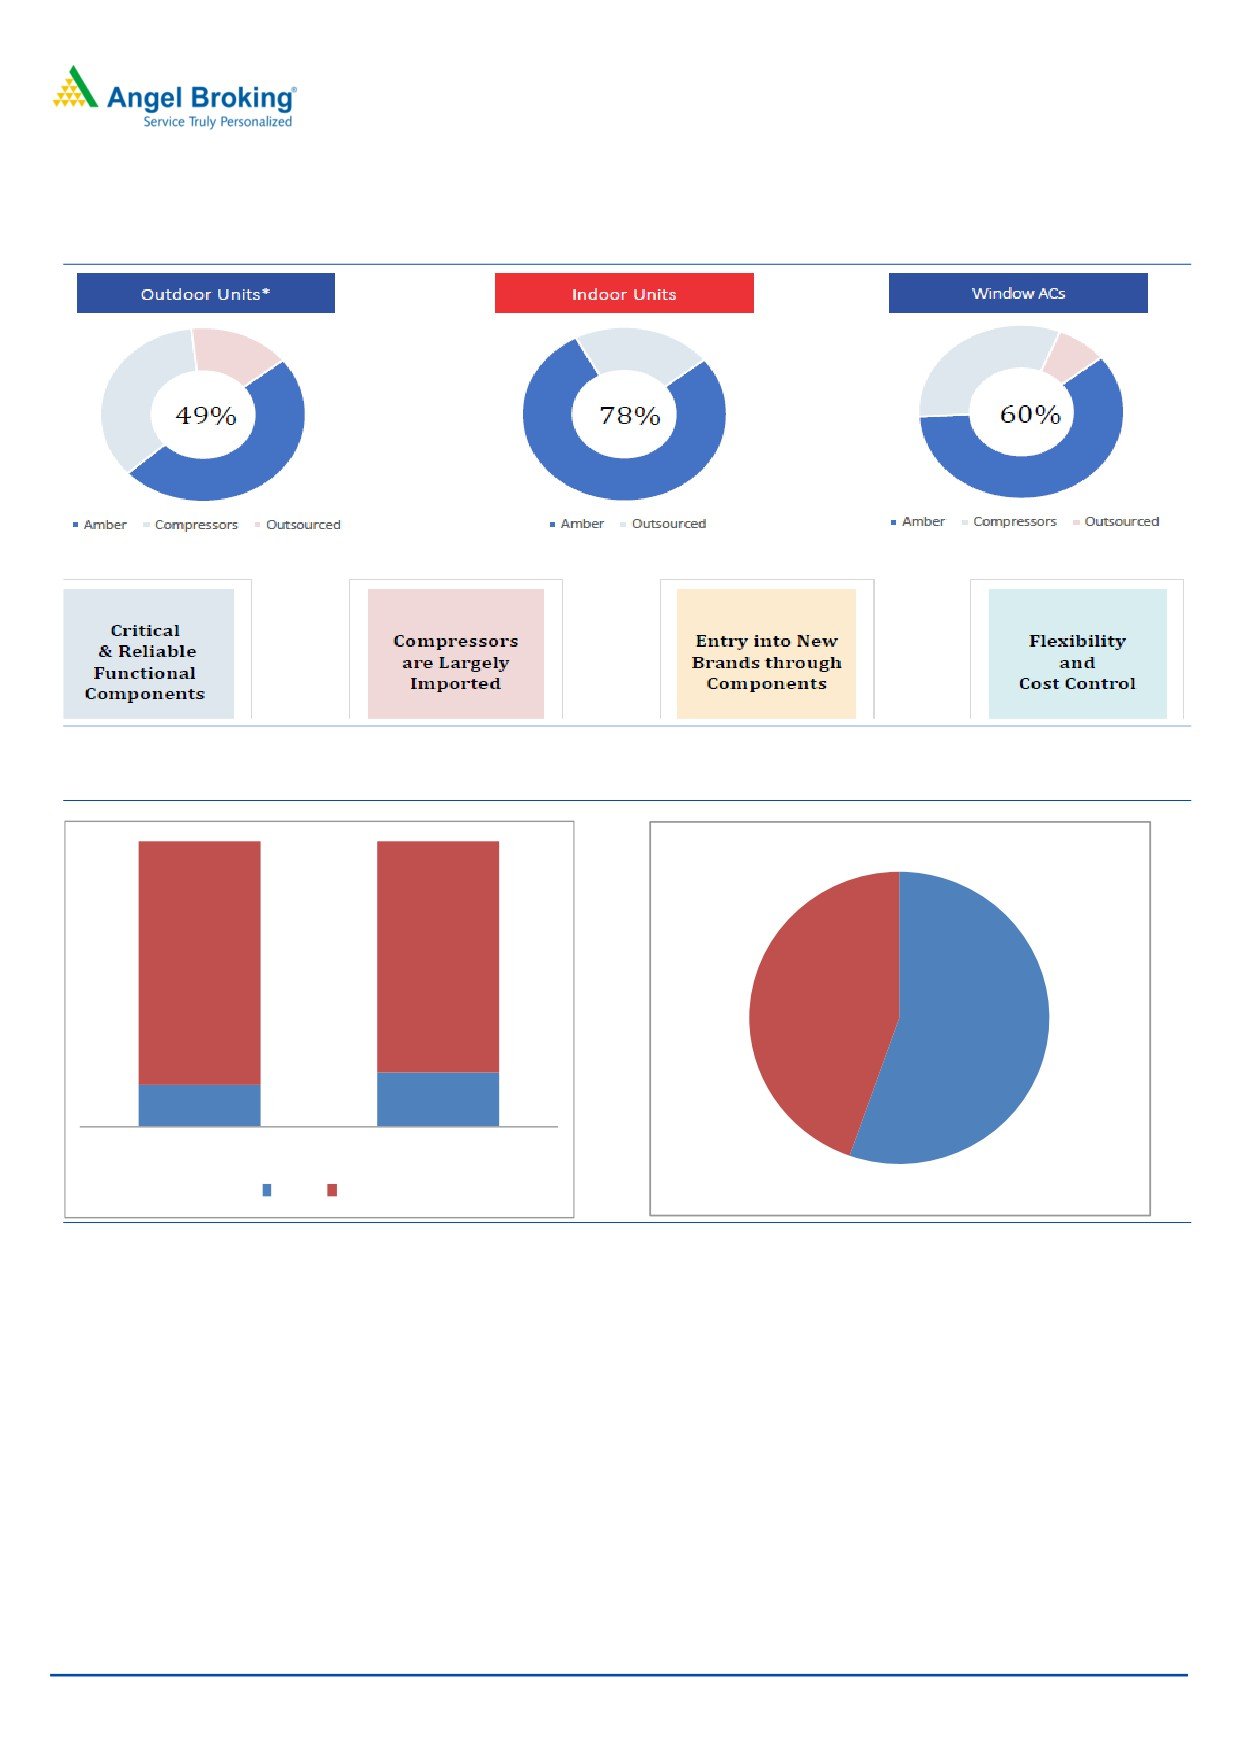
Exhibit 6: High degree of Backward Integration
Source: Company
Exhibit 7: Growing share of OEM/ ODM in RAC manufacturing: Amber commands 55% in outsourced one
81%
85%
Others
45%
Amber
55%
19%
15%
FY15
FY17
Amber Others
Source: Company, Frost and Sullivan
Exports could also flourish
Amber has posted revenue CAGR of 19% over FY13-18 mainly led by domestic market. Now, with its proven track record and
manufacturing capabilities, the company is now exploring export opportunities to UAE, Oman, SriLanka, Nigeria & South Africa.
The company is looking to increase exports to form 5-7% of revenue by FY2021-22.
June 21, 2018
6
Amber Enterprises | Initiating Coverage
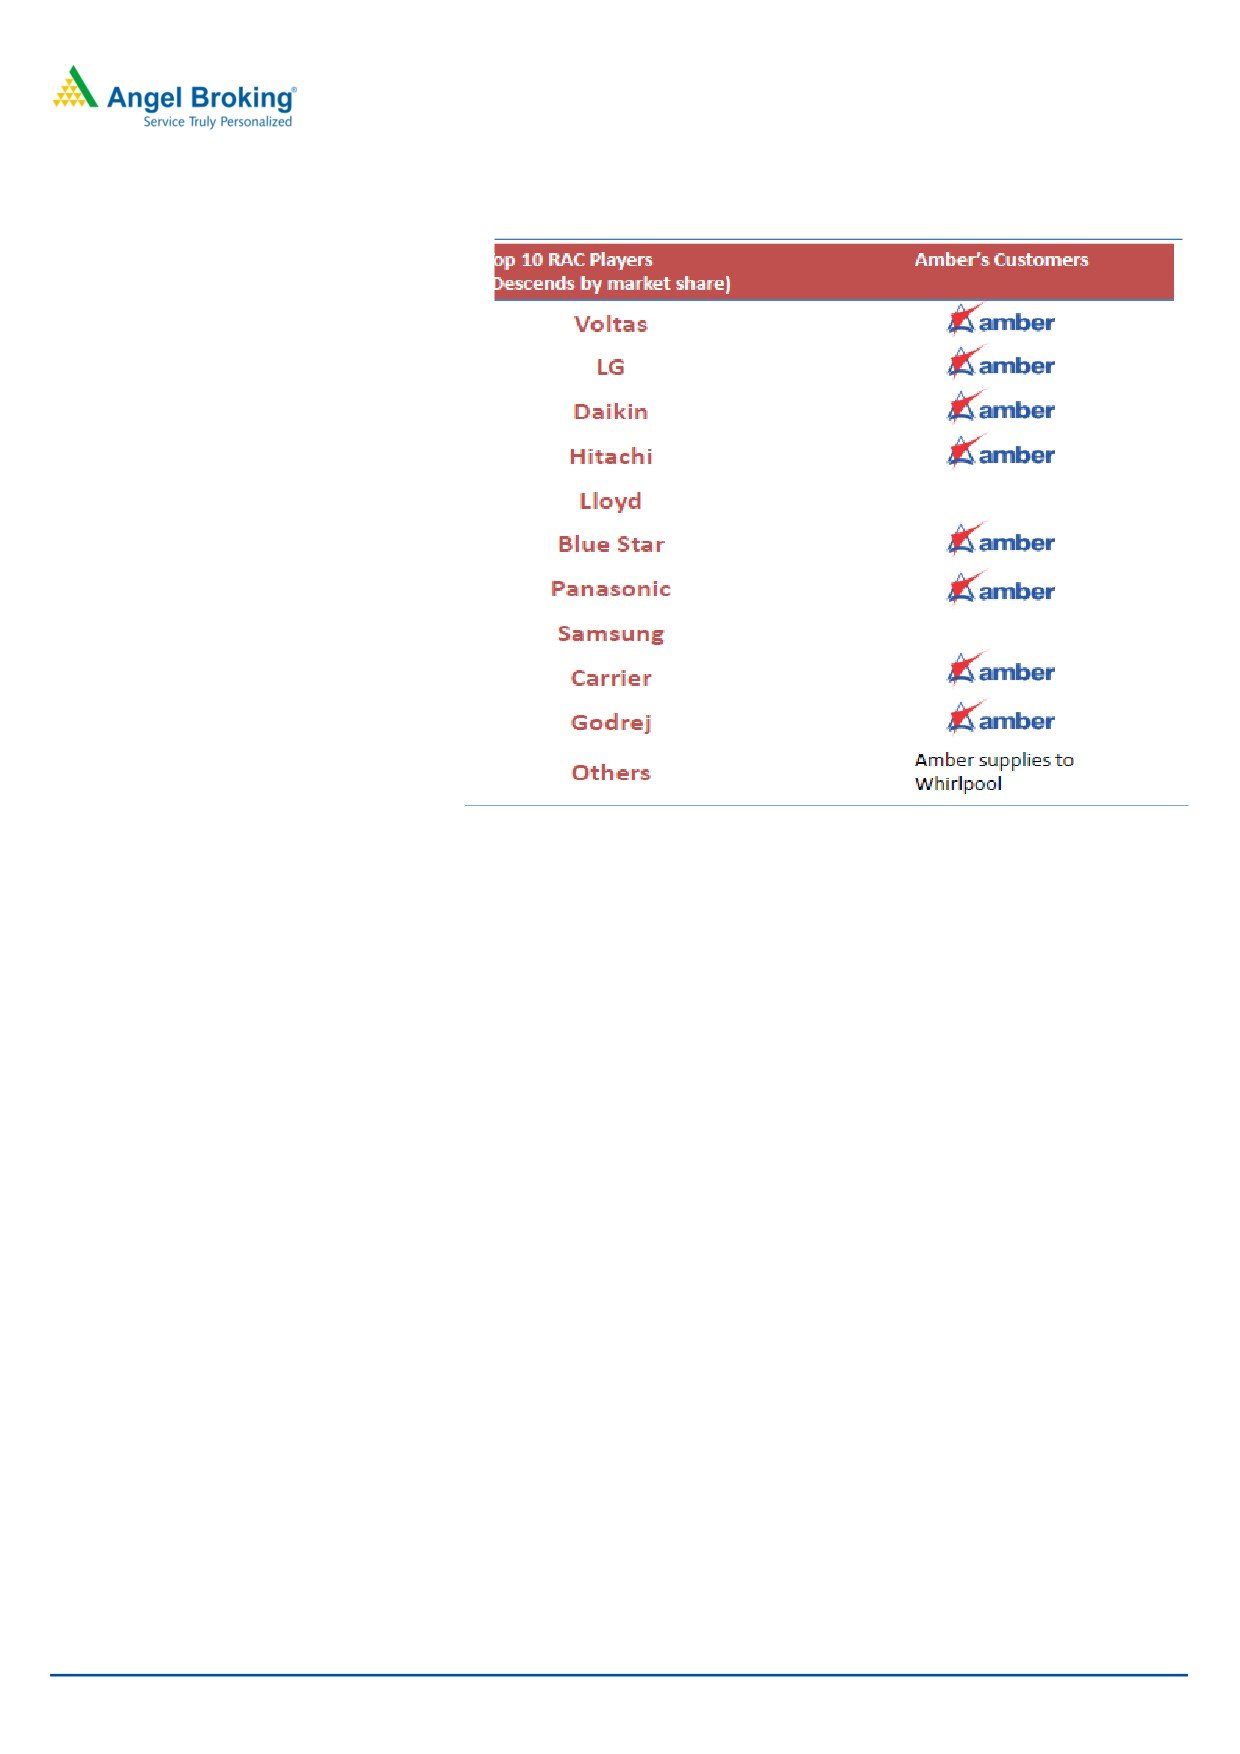
Exhibit 8: Amber supplies to over 75% of the ACs market
Source: Company, Angel Research
Recent Acquisitions to further boost its manufacturing capabilities
In line with its strategy to capture more wallet share and increase offerings in
inverter RACs and consumer appliances like Microwave and Refrigerator, it has
made 2 acquisitions in the printed circuit board (PCB) manufacturing space over
the last 1 year; IL JIN Electronics and Ever Electronics. PCB forms a critical part of
inverter ACs.
IL JIN
IL JIN Electronics was acquired for `54 cr for 70% stake before the IPO and is one
of the largest PCB manufacturing companies in the space of air conditioners and
white goods category. In FY2018, ‘IL JIN’ contributed Rs 100 crore to Amber’s
consolidated operating revenue (accounting sales for 3 month only) with a
operating margin of 3.5-4%. The company expects to improve its margins by at
least 100bps by FY2020.
Ever Electronics
Ever Electronics (EVER) is one of the leading electronic PCB manufacturers in India.
LG, LS Automotive, Powercraft Electronics, Godrej and Intangibles Labs are among
its major clients. After acquiring its 19 % stake in Q4FY2018 for `5.6 cr, Amber is
scheduled to acquire an additional 51% stake in the company by FY2019 for
`15.5 cr. EVER has posted a revenue of `225 cr in FY2018 and likely to grow by
15-20% in FY2019. Margins are low at 3-3.5% which are expected to improve by
operational synergies on merger.
Strong boost in profits and debt reduction
The company improved its margins to 8.6% in FY2018 led by higher capacity
utilization amid robust RACs’ demand. Due to recent acquisitions ( expected to
form ~20-22% of revenue in FY2019) which have lower margins, overall margins
June 21, 2018
7
Amber Enterprises | Initiating Coverage
may not expand in near term, but operating profits will see good jump on an
absolute basis. It currently has small working capital debt only post IPO which will
substantially reduce its interest cost in FY2019. The company is not planning to
undertake any major capex in the next 2-3 years. Its maintenance capex of `40
crore could be easily funded via internal accruals.
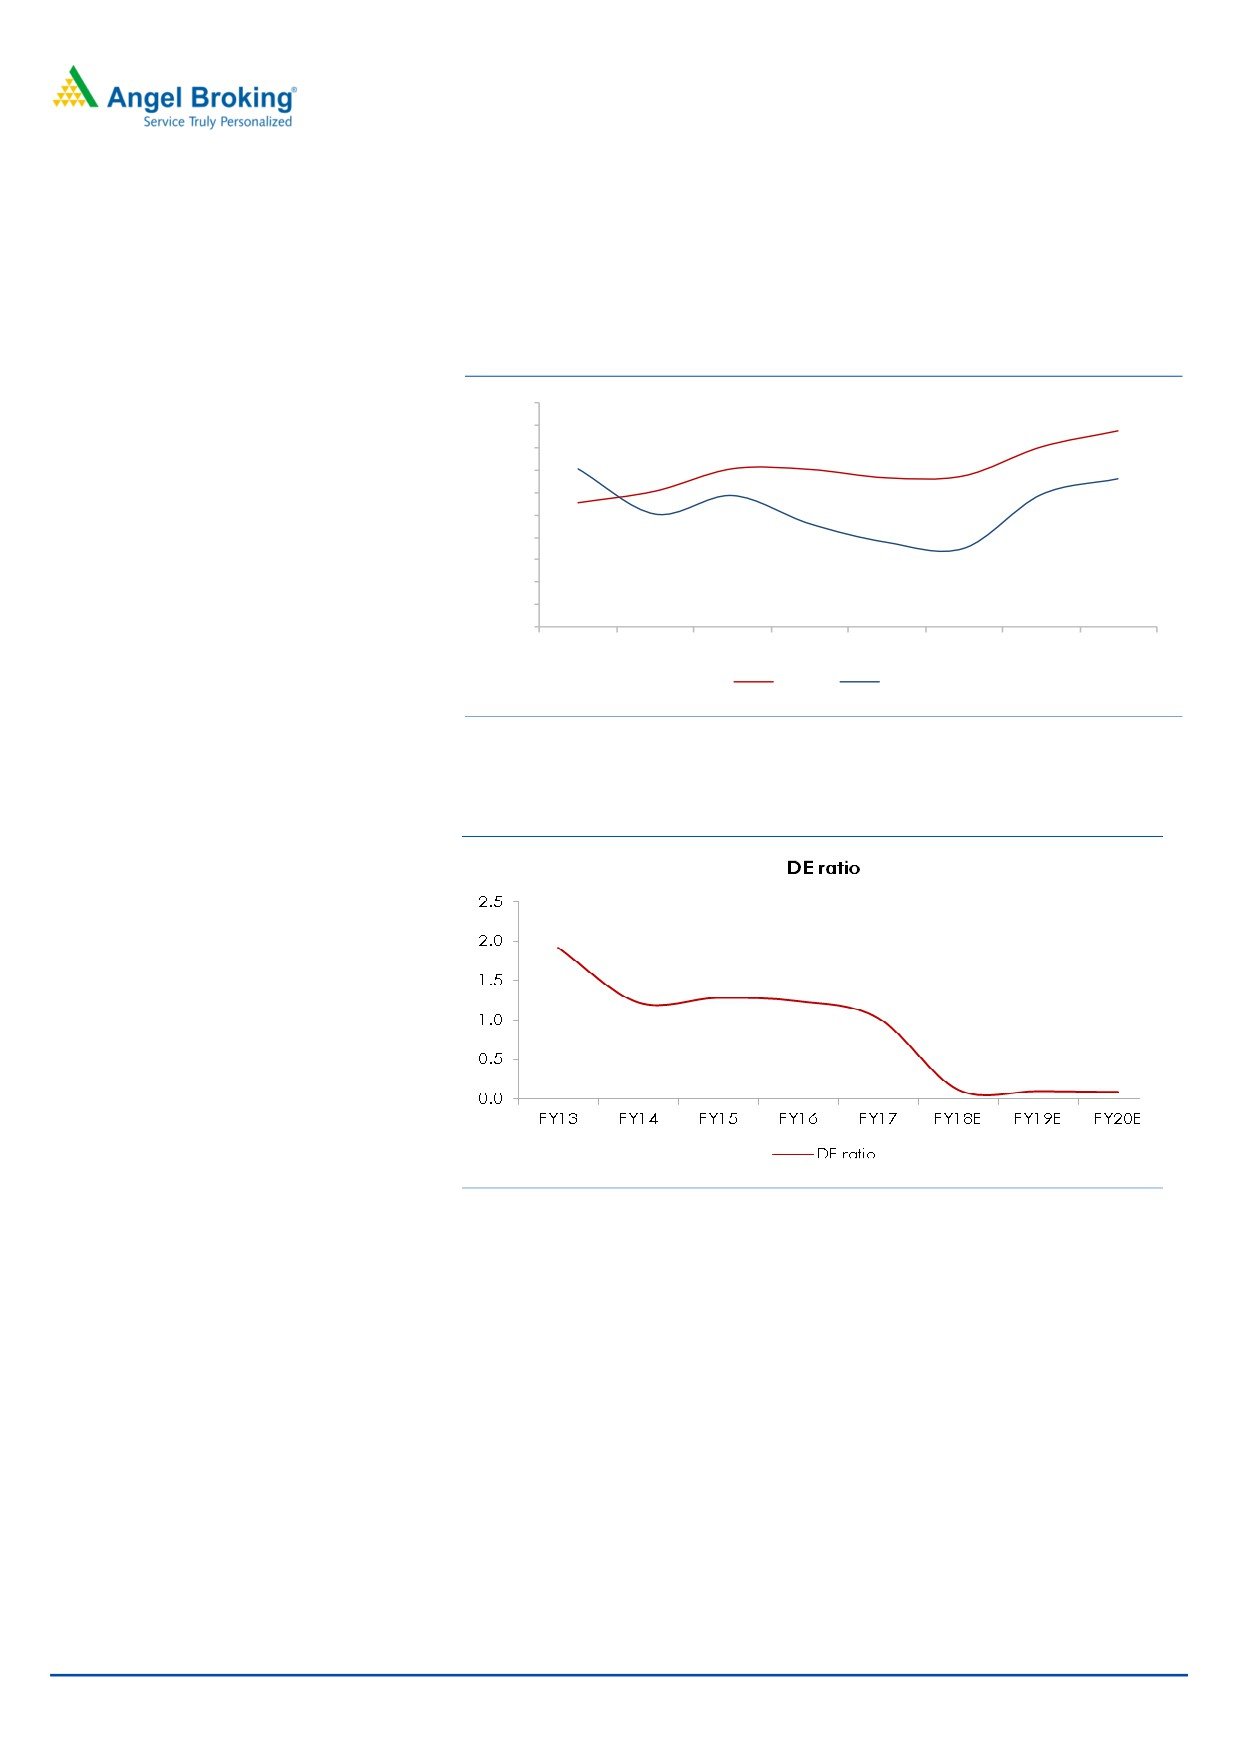
Exhibit 9: Returns ratio to improve with better utilization
20.0
18.0
16.0
14.0
12.0
10.0
8.0
6.0
4.0
2.0
-
FY13
FY14
FY15
FY16
FY17
FY18E FY19E FY20E
ROCE
ROE
Source: Company, Angel Research
Exhibit 10: DE ratio went down post IPO
Source: Company, Angel Research
June 21, 2018
8
Amber Enterprises | Initiating Coverage
Outlook
Amber has reported a CAGR of 19%/ 27% in revenue/ PAT over FY2013-18 led by
rising volume and improving margins. We expect it to report net revenue/PAT
CAGR of 28%/51% respectively over FY2018-20E. Revenue will increase by 39%
yoy in FY2019, mainly due to consolidation of its recent 2 acquisitions and a
~12% growth in standalone business. In FY2020, the revenue is estimated to
increase by 18% yoy. Due to recent acquisitions ( expected to form ~20-22% of
revenue in FY2019) which have lower margins, overall margins may not expand in
near term, but operating profits will see good jump on an absolute basis. We are
estimating a PAT margin of 4%, up from past level of 2-3%.
Valuation
Post the recent correction, Amber is currently trading at 21x FY2020 earnings
which is at ~25-30%+ discount than its closest peer - Dixon Technologies. The
stock has been trading at an average of 32 forward PE in its brief trading history
post IPO in January 2018. The recent correction has provided a very good entry
point for the investors to take a bet on the booming AC space. Hence, we initiate
coverage on the stock with a BUY recommendation and Target Price of `1272
(28x FY2020E EPS), an upside of 32% from the current levels.
Exhibit 10: Peer valuation
Dixon Technologies
Amber Enterprises
` Cr
FY2018
FY2019E
FY2020E
FY2018
FY2019E
FY2020E
Revenue
2,904.5
3,590.6
4,265.9
2,128.1
2,957.5
3,489.8
Operating Profit
99.8
141.4
183.3
183.5
221.8
261.7
OPM %
3.4%
3.9%
4.3%
8.6%
7.5%
7.5%
Pre-Tax Profit
91.6
135.5
176.0
89.4
162.2
205.0
Net Income Adj
63.4
93.3
121.2
62.3
113.0
142.9
EPS, Adj+
56.2
82.4
107.0
19.8
35.9
45.4
P/E
52.2
35.6
27.4
48.7
26.8
21.2
Return on Equity( %)
23.7
25.7
26.8
7.0
11.4
12.9
Source: Angel Research, Bloomberg
Key risks
Client concentration
Amber’s business is dependent on certain principal customers and the loss of or a
significant reduction in their purchases could adversely affect its business. Its top
five and 10 customers contributed 74.8% and 92.5% respectively to sales in FY17.
Adverse trend in OEM/ODM
In recent years, RAC brands have increasingly outsourced the manufacturing of
their products to OEM/ODM players like Amber. However, there can be no
assurance that they will continue to do so in the future.
Changing preferences, advancement in technology
The markets in which company’s customers compete are characterized by
consumers and their rapidly changing preferences, advancement in technology
and other related factors including lower manufacturing costs. Hence, the
company may be affected by any disruptions in the industry.
June 21, 2018
9
Amber Enterprises | Initiating Coverage
Consolidated Income Statement
Y/E March (` cr)
FY2016
FY2017
FY2018
FY2019E FY2020E
Total operating income
1,089.0
1,651.9
2,128.1
2,957.5
3,489.8
% chg
-11.5
51.7
28.8
39.0
18.0
Total Expenditure
975.3
1,521.3
1,944.5
2,735.7
3,228.1
Raw Material
858.5
1,371.2
1,768.8
2,513.9
2,966.4
Personnel
36.5
43.7
49.8
59.1
69.8
Others Expenses
80.3
106.5
125.9
162.7
191.9
EBITDA
113.7
130.5
183.5
221.8
261.7
% chg
10.9
14.8
40.6
20.9
18.0
(% of Net Sales)
10.4
7.9
8.6
7.5
7.5
Depreciation& Amortisation
30.9
40.1
49.0
51.2
54.3
EBIT
82.9
90.4
134.5
170.6
207.5
% chg
7.6
9.1
48.8
26.8
21.6
(% of Net Sales)
7.6
5.5
6.3
5.8
5.9
Interest & other Charges
53.2
63.5
53.8
18.8
15.0
Other Income
3.1
8.8
8.7
10.5
12.6
(% of Sales)
0.3
0.5
0.4
0.4
0.4
Extraordinary Items
-
-
-
-
-
Share in profit of Associates
-
-
-
-
-
Recurring PBT
32.7
35.7
89.4
162.2
205.0
% chg
-19.0
9.2
150.4
81.4
26.4
Tax
8.6
10.5
27.1
49.2
62.1
PAT (reported)
24.1
25.2
62.3
113.0
142.9
% chg
-13.5
4.5
147.4
81.4
26.4
(% of Net Sales)
2.2
1.5
2.9
3.8
4.1
Basic & Fully Diluted EPS (Rs)
7.7
8.0
19.8
35.9
45.4
% chg
-13.5
4.5
147.4
81.4
26.4
Source: Company, Angel Research
June 21, 2018
10
Amber Enterprises | Initiating Coverage
Consolidated Balance Sheet
Y/E March (` cr)
FY2016
FY2017
FY2018
FY2019E FY2020E
SOURCES OF FUNDS
Equity Share Capital
21.7
23.8
31.4
31.4
31.4
Reserves& Surplus
240.9
311.1
861.3
956.7
1,077.2
Shareholders’ Funds
262.6
334.9
892.8
988.1
1,108.6
Minority Interest
-
-
-
-
-
Total Loans
326.6
344.9
105.5
100.0
100.0
Other Liab & Prov
80.8
46.8
64.4
89.5
105.7
Total Liabilities
670.0
726.6
1,062.7
1,177.7
1,314.3
APPLICATION OF FUNDS
Net Block
536.1
577.5
739.8
789.8
839.8
Capital Work-in-Progress
2.0
3.0
4.0
5.0
6.0
Investments
-
-
5.7
55.7
105.7
Current Assets
533.6
650.4
964.0
1,237.0
1,438.6
Inventories
225.8
267.7
395.6
486.2
573.7
Sundry Debtors
247.9
310.4
378.6
486.2
573.7
Cash
18.4
34.7
133.8
172.4
181.6
Loans & Advances
40.6
37.1
28.3
59.1
69.8
Other Assets
1.0
0.5
27.6
33.1
39.8
Current liabilities
445.0
560.0
665.8
925.3
1,091.9
Net Current Assets
88.6
90.4
298.2
311.7
346.7
Other Non Current Asset
45.3
58.6
19.1
20.5
22.2
Total Assets
670.0
726.6
1062.7
1177.6
1314.3
Source: Company, Angel Research
June 21, 2018
11
Amber Enterprises | Initiating Coverage
Consolidated Cash Flow Statement
Y/E March (`cr)
FY2016
FY2017
FY2018
FY2019E
FY2020E
Profit before tax
32.7
38.4
89.4
162.2
205.0
Depreciation
30.9
39.7
49.0
51.2
54.3
Change in Working Capital
42.9
(23.3)
(67.7)
(37.8)
(84.7)
Interest / Dividend (Net)
-
-
-
-
-
Direct taxes paid
(10.5)
(9.0)
(27.1)
(49.2)
(62.1)
Others
(56.2)
(52.7)
(38.8)
(5.4)
15.8
Cash Flow from Operations
152.2
98.5
82.4
131.9
96.6
(Inc.)/ Dec. in Fixed Assets
(101.2)
(82.0)
(162.2)
(50.0)
(50.0)
(Inc.)/ Dec. in Investments
1.4
0.8
-
-
-
Cash Flow from Investing
(83.9)
(89.7)
(162.2)
(50.0)
(50.0)
Issue of Equity
-
50.0
505.3
-
-
Inc./(Dec.) in loans
150.6
46.4
(239.4)
(5.5)
-
Others
218.5
97.6
63.6
36.5
37.4
Cash Flow from Financing
(67.9)
(1.2)
202.3
(42.0)
(37.4)
Inc./(Dec.) in Cash
0.4
7.6
122.5
39.8
9.3
Opening Cash balances
2.0
2.4
10.0
132.5
172.4
Closing Cash balances
2.4
10.0
132.5
172.4
181.6
Source: Company, Angel Research
Key Ratios
Y/E March
FY2016
FY2017
FY2018
FY2019E
FY2020E
Valuation Ratio (x)
P/E (on FDEPS)
125.9
120.5
48.7
26.8
21.2
P/CEPS
28.5
25.4
12.4
7.5
6.0
P/BV
11.6
9.1
3.4
3.1
2.7
Dividend yield (%)
-
-
-
-
EV/Sales
3.0
2.0
1.4
1.0
0.8
EV/EBITDA
29.1
25.4
16.0
12.8
10.6
EV / Total Assets
4.9
4.6
2.8
2.4
2.1
Per Share Data (`)
EPS (fully diluted)
7.7
8.0
19.8
35.9
45.4
Cash EPS
33.9
37.9
77.9
129.3
160.1
Book Value
83.5
106.5
283.9
314.2
352.5
Returns (%)
ROCE
14.1
13.3
13.5
15.7
17.2
Angel ROIC (Pre-tax)
13.7
13.9
15.9
19.5
21.8
ROE
9.2
7.5
7.0
11.4
12.9
Turnover ratios (x)
Asset Turnover (Gross Block)
2.3
2.9
3.8
4.8
5.3
Inventory / Sales (days)
76
59
68
60
60
Receivables (days)
83
69
65
60
60
Payables (days)
95
99
98
98
98
Working capital cycle (ex-cash) (days)
64
29
35
22
22
Source: Company, Angel Research
June 21, 2018
12
Amber Enterprises | Initiating Coverage
Research Team Tel: 022 - 39357800
DISCLAIMER
Angel Broking Private Limited (hereinafter referred to as “Angel”) is a registered Member of National Stock Exchange of India Limited,
Bombay Stock Exchange Limited and Metropolitan Stock Exchange Limited. It is also registered as a Depository Participant with CDSL
and Portfolio Manager and Investment Adviser with SEBI. It also has registration with AMFI as a Mutual Fund Distributor. Angel Broking
Private Limited is a registered entity with SEBI for Research Analyst in terms of SEBI (Research Analyst) Regulations, 2014 vide
registration number INH000000164. Angel or its associates has not been debarred/ suspended by SEBI or any other regulatory
authority for accessing /dealing in securities Market. Angel or its associates/analyst has not received any compensation / managed or
co-managed public offering of securities of the company covered by Analyst during the past twelve months.
This document is solely for the personal information of the recipient, and must not be singularly used as the basis of any investment
decision. Nothing in this document should be construed as investment or financial advice. Each recipient of this document should
make such investigations as they deem necessary to arrive at an independent evaluation of an investment in the securities of the
companies referred to in this document (including the merits and risks involved), and should consult their own advisors to determine
the merits and risks of such an investment.
Reports based on technical and derivative analysis center on studying charts of a stock's price movement, outstanding positions and
trading volume, as opposed to focusing on a company's fundamentals and, as such, may not match with a report on a company's
fundamentals. Investors are advised to refer the Fundamental and Technical Research Reports available on our website to evaluate the
contrary view, if any
The information in this document has been printed on the basis of publicly available information, internal data and other reliable
sources believed to be true, but we do not represent that it is accurate or complete and it should not be relied on as such, as this
document is for general guidance only. Angel Broking Pvt. Limited or any of its affiliates/ group companies shall not be in any way
responsible for any loss or damage that may arise to any person from any inadvertent error in the information contained in this report.
Angel Broking Pvt. Limited has not independently verified all the information contained within this document. Accordingly, we cannot
testify, nor make any representation or warranty, express or implied, to the accuracy, contents or data contained within this document.
While Angel Broking Pvt. Limited endeavors to update on a reasonable basis the information discussed in this material, there may be
regulatory, compliance, or other reasons that prevent us from doing so.
This document is being supplied to you solely for your information, and its contents, information or data may not be reproduced,
redistributed or passed on, directly or indirectly.
Neither Angel Broking Pvt. Limited, nor its directors, employees or affiliates shall be liable for any loss or damage that may arise from
or in connection with the use of this information.
Note: Please refer to the important ‘Stock Holding Disclosure' report on the Angel website (Research Section). Also, please refer to the
latest update on respective stocks for the disclosure status in respect of those stocks. Angel Broking Pvt. Limited and its affiliates may
have investment positions in the stocks recommended in this report.
Disclosure of Interest Statement
Amber Enterprises India Ltd.
1. Financial interest of research analyst or Angel or his Associate or his relative
No
2. Ownership of 1% or more of the stock by research analyst or Angel or associates or relatives
No
3. Served as an officer, director or employee of the company covered under Research
No
4. Broking relationship with company covered under Research
No
Ratings (Based on expected returns
Buy (> 15%)
Accumulate (5% to 15%)
Neutral (-5 to 5%)
over 12 months investment period):
Reduce (-5% to -15%)
Sell (< -15)
June 21, 2018
13